Treated HPHT Laboratory-Grown Diamond with Dramatic Color Zoning
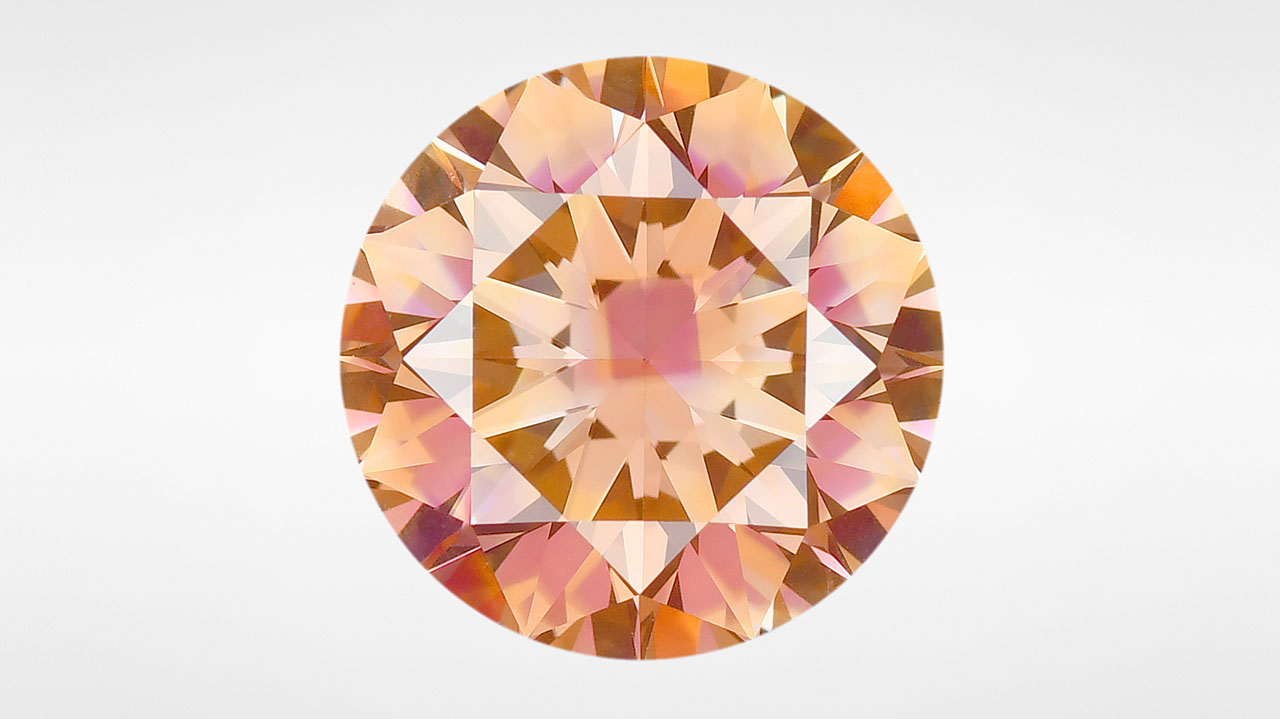

Recently, the Carlsbad laboratory examined a 2.20 ct laboratory-grown diamond that received a color grade of Fancy Deep brownish orange (figure 1). Spectroscopic analysis indicated high-pressure, high-temperature (HPHT) growth methods and subsequent irradiation and annealing to create nitrogen vacancy centers. Infrared absorption spectra collected from the entire stone identified it as type Ib with a concentration of ~5 ppm of single isolated nitrogen. The diamond was distinctive because of a pronounced pink square under the table facet within the cubic {100} sector. The other major growth sectors (e.g., {110}, {111}) surrounding the central cubic sector appeared yellow due to single isolated nitrogen. The pink growth sector displayed pronounced reflections when viewed through the pavilion facets and had more of a purple color (figure 2).

Visible/near-infrared (Vis-NIR) absorption spectra were collected from the center of the table using a reflectance probe positioned to show pink fluorescence. The probe was then repositioned toward the crown facets that did not show pink fluorescence (figure 3). The spectra from both areas indicated type Ib-related absorption at low wavelengths. Additionally, the pink color region was dominated by the NV– center (zero-phonon line, or ZPL, at 637 nm) and its associated sidebands, while the surrounding yellow regions had minor absorption from NV0 (ZPL at 575 nm). This difference in NV-related absorption shifts the transmission window from pink to yellow.
The uptake of single nitrogen is generally lower in {100} growth sectors than in {111} sectors (R.C. Burns et al., “Growth-sector dependence of optical features in large synthetic diamonds,” Journal of Crystal Growth, Vol. 104, 1990, pp. 257–279). However, the concentration of single nitrogen (necessary to ultimately create NV centers) can be increased within the cubic sector through lower growth temperatures (S. Satoh et al., “Differences in nitrogen concentration and aggregation among (111) and (100) growth sectors of large synthetic diamonds,” Science and Technology of New Diamond, KTK Scientific Publishers/Terra Scientific Publishing Co., Tokyo, 1990, pp. 351–355). It is possible that such growth conditions were used with this diamond in order to incorporate sufficient nitrogen within the cubic sectors, which were subsequently transformed to NV centers with treatment.
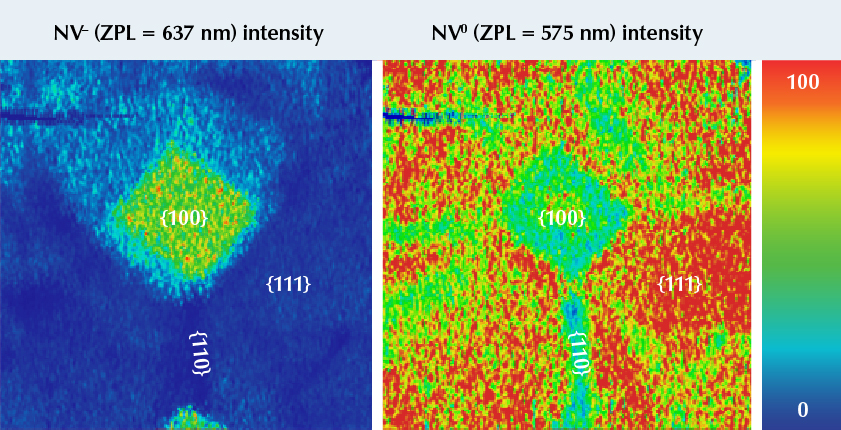
Within the cubic sector, photoluminescence (PL) mapping showed a significantly higher concentration of NV– compared with the other major growth sectors (e.g., {110} and {111}), while the concentration of NV0 was lower (figure 4). The presence of donors, such as single nitrogen, can often shift the balance between neutral and negative NV centers so that NV– is enhanced in diamonds with single nitrogen (I.A. Dobrinets et al., HPHT-Treated Diamonds: Diamonds Forever, 2013, Springer-Verlag, Berlin). The presence of single nitrogen can be related to an elevated concentration of NV– within the cubic sector; however, in the {111} sectors, NV0 dominates over NV– despite the appreciable concentrations of single nitrogen. This can likely be attributed to the {111} sectors also preferentially incorporating boron. Although boron was not detected within the infrared absorption spectra for this stone, it is often present in HPHT-grown diamond, even at low concentrations. Since boron preferentially incorporates within {111} sectors (U.F.S. D’Haenens-Johansson et al., “Synthesis of diamonds and their identification,” Reviews in Mineralogy and Geochemistry, Vol. 88, No. 1, 2022, pp. 689–753), these acceptors could shift the charge balance within those areas, thus causing the preferential creation of NV0 over NV–.
PL mapping highlighted other pronounced differences between the growth sectors. The GR1 defect (V0) and TR12, an irradiation-related defect with ZPL at 469.9 nm, was highest in {110} and negligible in {100}. The nickel-related doublet at 883/884 nm was extremely high in {111} and negligible in {110} and {100}.
This HPHT-grown diamond is a notable example of growth techniques and treatment engineering producing a combination of defects that is visually interesting. The faceting approach, in which the pink growth sector was positioned under the table facet, served to enhance the dramatic appearance.